OVERVIEW
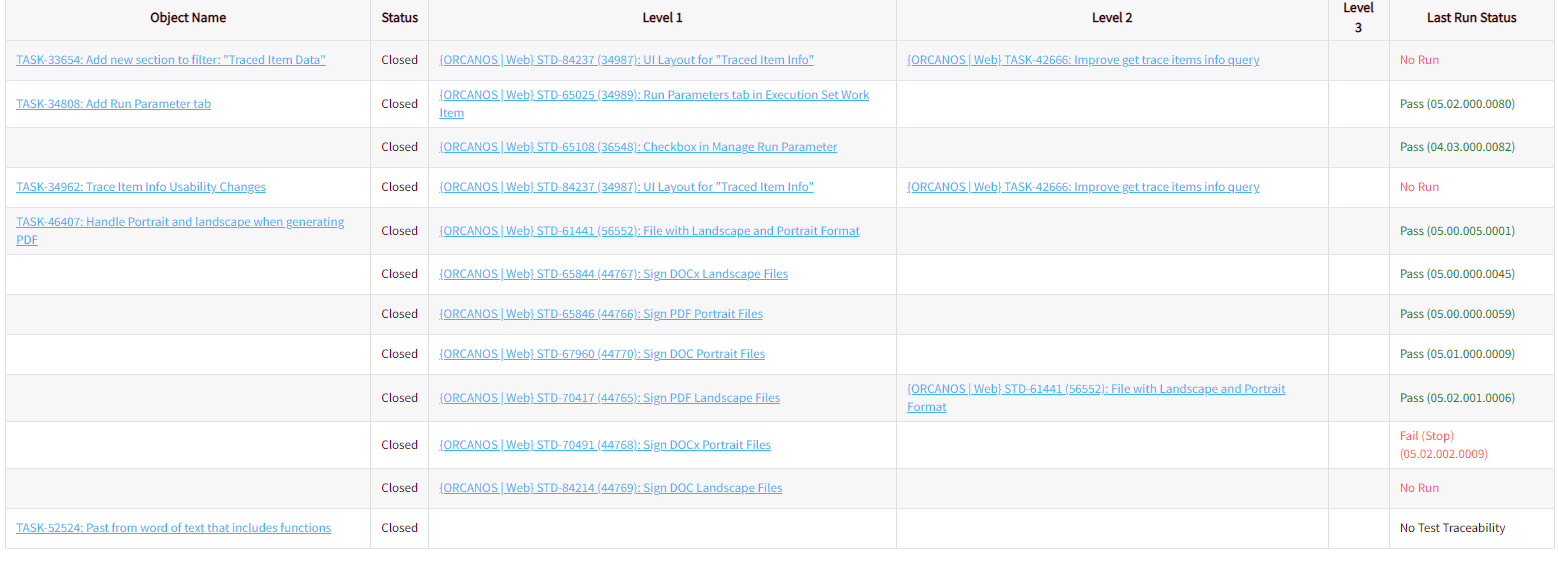
Orcanos multi-level Traceability Matrix helps you to track the relations between work items such as Risks, Requirements, Test cases, CAPA, ECO, etc.
Traceability matrix can be used to track missing relations and quality deficiencies, such as failed tests, risks without mitigation, and more.
You can click the work item hyperlink in order to view the details of each work item.
Traceability matrix is just a special type of presentation to a selected filter.
Traceability matrix supports 3 levels of relations depth, for selected source, for example:
We will track the traceability matrix of specific project Risks, to the mitigation (for example, software requirements), mitigation verification (such as test cases) and verification results
TO ADD NEW TRACEABILITY MATRIX PANEL FROM DASHBOARD
- Select the Dashboard on the main menu to enter the Dashboard.
- Click the ‘+’ icon button on select ‘Panels‘ option
- The Manage Dashboard Panel popup window is displayed with the following fields:
- Name: Enter the Name of the Panel
- Project: Select the Project
- Work Item: Select any work item from the list, all active work items will be listed. Precisely it would be Risk item. (Select only one work item)
- Filter: Select any public/private Filter.
- Report Type: Select the Report Type as ‘Traceability Matrix‘.
- Size: Select the width of the screen to display the data from the Size dropdown list.
- Height: Select the Height from the list of values.
- Is Private: You can select the Is Private checkbox to make the panel private. If the Filter is private then it will be default checked. User cannot uncheck it to make it Public.
- Press Save
 Level Data Description
It displays all the work items pointing to Filter results i.e: Downstream – where filter results are the target (Direction of the related item is <- i.e. Red arrow)
For E.g: Object A is linked to Item A1, such that Object A is target and direction of the link is Object A <– Item A1. So, Item A1 would be listed in Level 1 Column
In case of Item A1 is linked to Item A2, such that Item A1 is target and direction of the link is Item A1 <– Item A2. So, Item A2 would be listed in Level 2 Column
In case of Item A2 is linked to Item A3, such that Item A2 is target and direction of the link is Item A2 <– Item A3. So, Item A3 would be listed in Level 3 Column
Last Run Status
In case a test case appears in any level of the traceability matrix, the last run status will be shown, as follows:
- Not in execution – This test was not linked to the execution set yet, therefore its not in QA plan
- No Run – This test is linked to the execution set, but was not executed yet
- Pass – This test was execution and pass
- Fail – This test was executed and failed
- Fail(Stop) – This test was failed and is a show stopper (Blocker)
- Not completed – this test was partially executed
If no test exists, the last run status will be “No Test Traceability”
In Traceability Report, Last Run Status depends on the selected project version.
If the User selects the lower version of the project then the Last Run Status of the test case executed in the lower Project version gets displayed.
If User selects the Advance version of the project then the Last Run Status of the test case executed in advance Project version gets displayed.
ACTIONS TOOLBAR
- HTML Export – Exports the data in HTML file format
- Excel Export – Exports the data in .XLSX file format
- Refresh – Refresh the data displayed
- Edit – Edits the Related Item Breakdown Panel details
- Edit filter – Edit the filter associated with the Related Item Breakdown Panel
- Full Screen – This shows the Panel in a different window in full-size
- Remove – Removes the panel from the dashboard, but not deleting it
When in Full-Screen mode, you can set the Auto-Refresh time – This option enables the users to set auto-refresh time for the panel.